cmd/compile: coverage instrumentation for fuzzing #14565
Comments
|
@dvyukov Do you have any references for how other toolchains implement this? Eg, I assume for cgo support, we'd want to do something that interoperates well with whatever the C compiler does. |
|
LLVM does this: In addition, we also do |
|
@kcc Thanks. A bunch of clarifying questions: What's the expected behavior when an 8-bit counter overflows? Should it saturate or wrap around? Do the increments need to be atomic? (I seem to recall suggesting LLVM should make them atomic, but then that turning out to be a performance hit.) Do I understand that the basic idea is the compiler should transform every into ? (I.e., for every branch point, we just need to increment a counter to indicate whether we took the true or false branch.) Or are there other cases we need to track, or maybe cases where we don't need to track? Do we need to do anything for goto/labels? (Intuitively I'd think no.) What about indirect function calls? I suppose we can hash (CALL instruction's PC, target instruction's PC) and increment some large indirect calls table. What about panics? If there's Does LLVM do any special linker stuff to ensure all the counters end up consecutively? E.g., put them in some ELF section? Do users care about knowing which counter maps to which source location? (Intuitively, I'm assuming you really only care that the coverage data is different than you've seen before.) -- In fact, if that's true (i.e., you only care to identify whether we've triggered new code paths), would it suffice to just keep a running hash for each G of any indirect call or conditional branch it takes? And then deterministically hash these together at the end? |
either is fine, but wrap around is easier to implement.
No. They will be racy, and for concurrent code will be imprecise. It's tolerable.
roughly -- yes.
Yes, we put the counters into a special ELF section so that for a given DSO all the counters are consecutive.
libFuzzer does care about it for various reasons.
With an extra flag, Also note the trick we are using to instrument edges and not just basic blocks: |
|
Thanks, that was helpful.
I saw that and read it a couple times, but I'm still a little unclear on what it's suggesting. Do I understand correctly that it's just emphasizing that has to be rewritten into and not simply into ? |
Yes. It makes the signal for the fuzzing engine stronger. |
What PC should be associated with each counter? The PC for the counter increment instruction? |
|
In our implementation it is the PC of the first instruction of the basic block (the function address for the entry block). Doesn't matter much though as long as you can correctly symbolize the PC. |
|
Okay. That sounds like enough info to get started with. Thanks! |
|
@kcc One more question: is there any preference for edges that are reported by instrumentation to more closely match the source language or the target language? For example, we compile: as something like: go-fuzz currently only inserts three counters (one for each explicit case, and then one more for the implicit empty default case). Is that preferred, or should we report edges based on compiled form (so ~10 counters for the above example), or does it not matter? |
|
Reporting more counters may increase the overhead a bit, but it may provide a bit more signal. |
|
Change https://golang.org/cl/202117 mentions this issue: |
|
Okay, so here's my progress for the day: CL 202117 is a very rough initial pass at implementing coverage instrumentation in the compiler and linker. The linker work probably needs some tweaking, but then it's basically done. The compiler could probably be a lot smarter though. It currently generates counters using Demo: Also, note that main.go is easily generated (go-fuzz-build operates by generating a very similar file). I don't expect most users to have to write it themselves; I expect them to only need to write a fuzz target like png.go (which is the target used above). |
|
(Also note that the demo above is using Go modules, which isn't currently supported by go-fuzz-build.) |
|
@mdempsky First, this is very exciting. Second, a quick FYI -- for the "Make fuzzing a first class citizen" proposal (#19109), Dmitry had written a few paragraphs with some initial thoughts on possible approaches to compiler integration in the "Coverage instrumentation" section of the proposal google doc here : https://docs.google.com/document/u/1/d/1zXR-TFL3BfnceEAWytV8bnzB2Tfp6EPFinWVJ5V4QC8/pub I'm sure Dmitry will comment here before long, so you should probably mostly ignore my comment, but just wanted to share that quick FYI in case useful while you are actively looking at this (but sorry in advance if you had seen that write-up recently, and/or if not otherwise useful). CC @josharian |
|
The key of that paragraph is: |
I think that's the case with my current CL. For the most part, Go doesn't guarantee any ABI stability. |
|
Change https://golang.org/cl/203887 mentions this issue: |
|
CL 203887 implements basic comparison tracing by calling Whereas before this would have to churn randomly and hope to stumble upon the magic 32-bit constant, now libFuzzer can find it almost instantaneously. |
|
Quick self interested question on this. I implemented a precise profiler for collecting dynamic control flow graphs of basic blocks a few years ago. It works reasonably well and I have a few research publications from the work (and a few more in the works). However, for all the reasons that it is difficult for go-fuzz to stay up to date it is tough for Dynagrok to stay up to date. So, here are my questions:
My overall goal is to get the Software Engineering community more interested in doing research on Go. They are pretty focused on Java and to some extent C++ and Javascript. The community has invented a few interesting techniques over the years and Go would actually be a great language for them to experiment on. |
|
Chatted with @timtadh about this directly a bit. This certainly isn't going to happen for Go 1.14; but for Go 1.15, I'll look into supporting something like Clang's -fsanitize-coverage=trace-pc-guard feature (to support fuzzing engines like AFL and Honggfuzz), which @timtadh thinks would be usable for Dynagrok too. |
This CL adds experimental coverage instrumentation similar to what
github.com/dvyukov/go-fuzz produces in its -libfuzzer mode. The
coverage can be enabled by compiling with -d=libfuzzer. It's intended
to be used in conjunction with -buildmode=c-archive to produce an ELF
archive (.a) file that can be linked with libFuzzer. See #14565 for
example usage.

The coverage generates a unique 8-bit counter for each basic block in
the original source code, and emits an increment operation. These
counters are then collected into the __libfuzzer_extra_counters ELF
section for use by libFuzzer.

Updates #14565.

Change-Id: I239758cc0ceb9ca1220f2d9d3d23b9e761db9bf1
Reviewed-on: https://go-review.googlesource.com/c/go/+/202117
Run-TryBot: Matthew Dempsky <mdempsky@google.com>
TryBot-Result: Gobot Gobot <gobot@golang.org>
Reviewed-by: Keith Randall <khr@golang.org>
This CL extends cmd/compile's experimental libFuzzer support with
calls to __sanitizer_cov_trace_{,const_}cmp{1,2,4,8}. This allows much
more efficient fuzzing of comparisons.

Only supports amd64 and arm64 for now.

Updates #14565.

Change-Id: Ibf82a8d9658f2bc50d955bdb1ae26723a3f0584d
Reviewed-on: https://go-review.googlesource.com/c/go/+/203887
Run-TryBot: Matthew Dempsky <mdempsky@google.com>
TryBot-Result: Gobot Gobot <gobot@golang.org>
Reviewed-by: Keith Randall <khr@golang.org>
|
I've submitted my CLs to add basic libfuzzer instrumentation to cmd/compile. I've also written a mostly-drop-in compatible tool at github.com/mdempsky/go114-fuzz-build that utilizes it. Make sure to have a recently updated and built Go development snapshot on your $PATH, and then you can try it out: My expectation is this instrumentation should be comparable to go-fuzz's "native" mode, and it should be better than go-fuzz's "libfuzzer" mode. However, I don't have that much experience with either dvyukov/go-fuzz or libfuzzer. It would be great if experienced go-fuzz users could give it a spin, and let me know their experiences. E.g., does it fuzz faster/slower? Does it succeed at finding any new failures that dvyukov/go-fuzz did not, or cases that it's unable to find? |
|
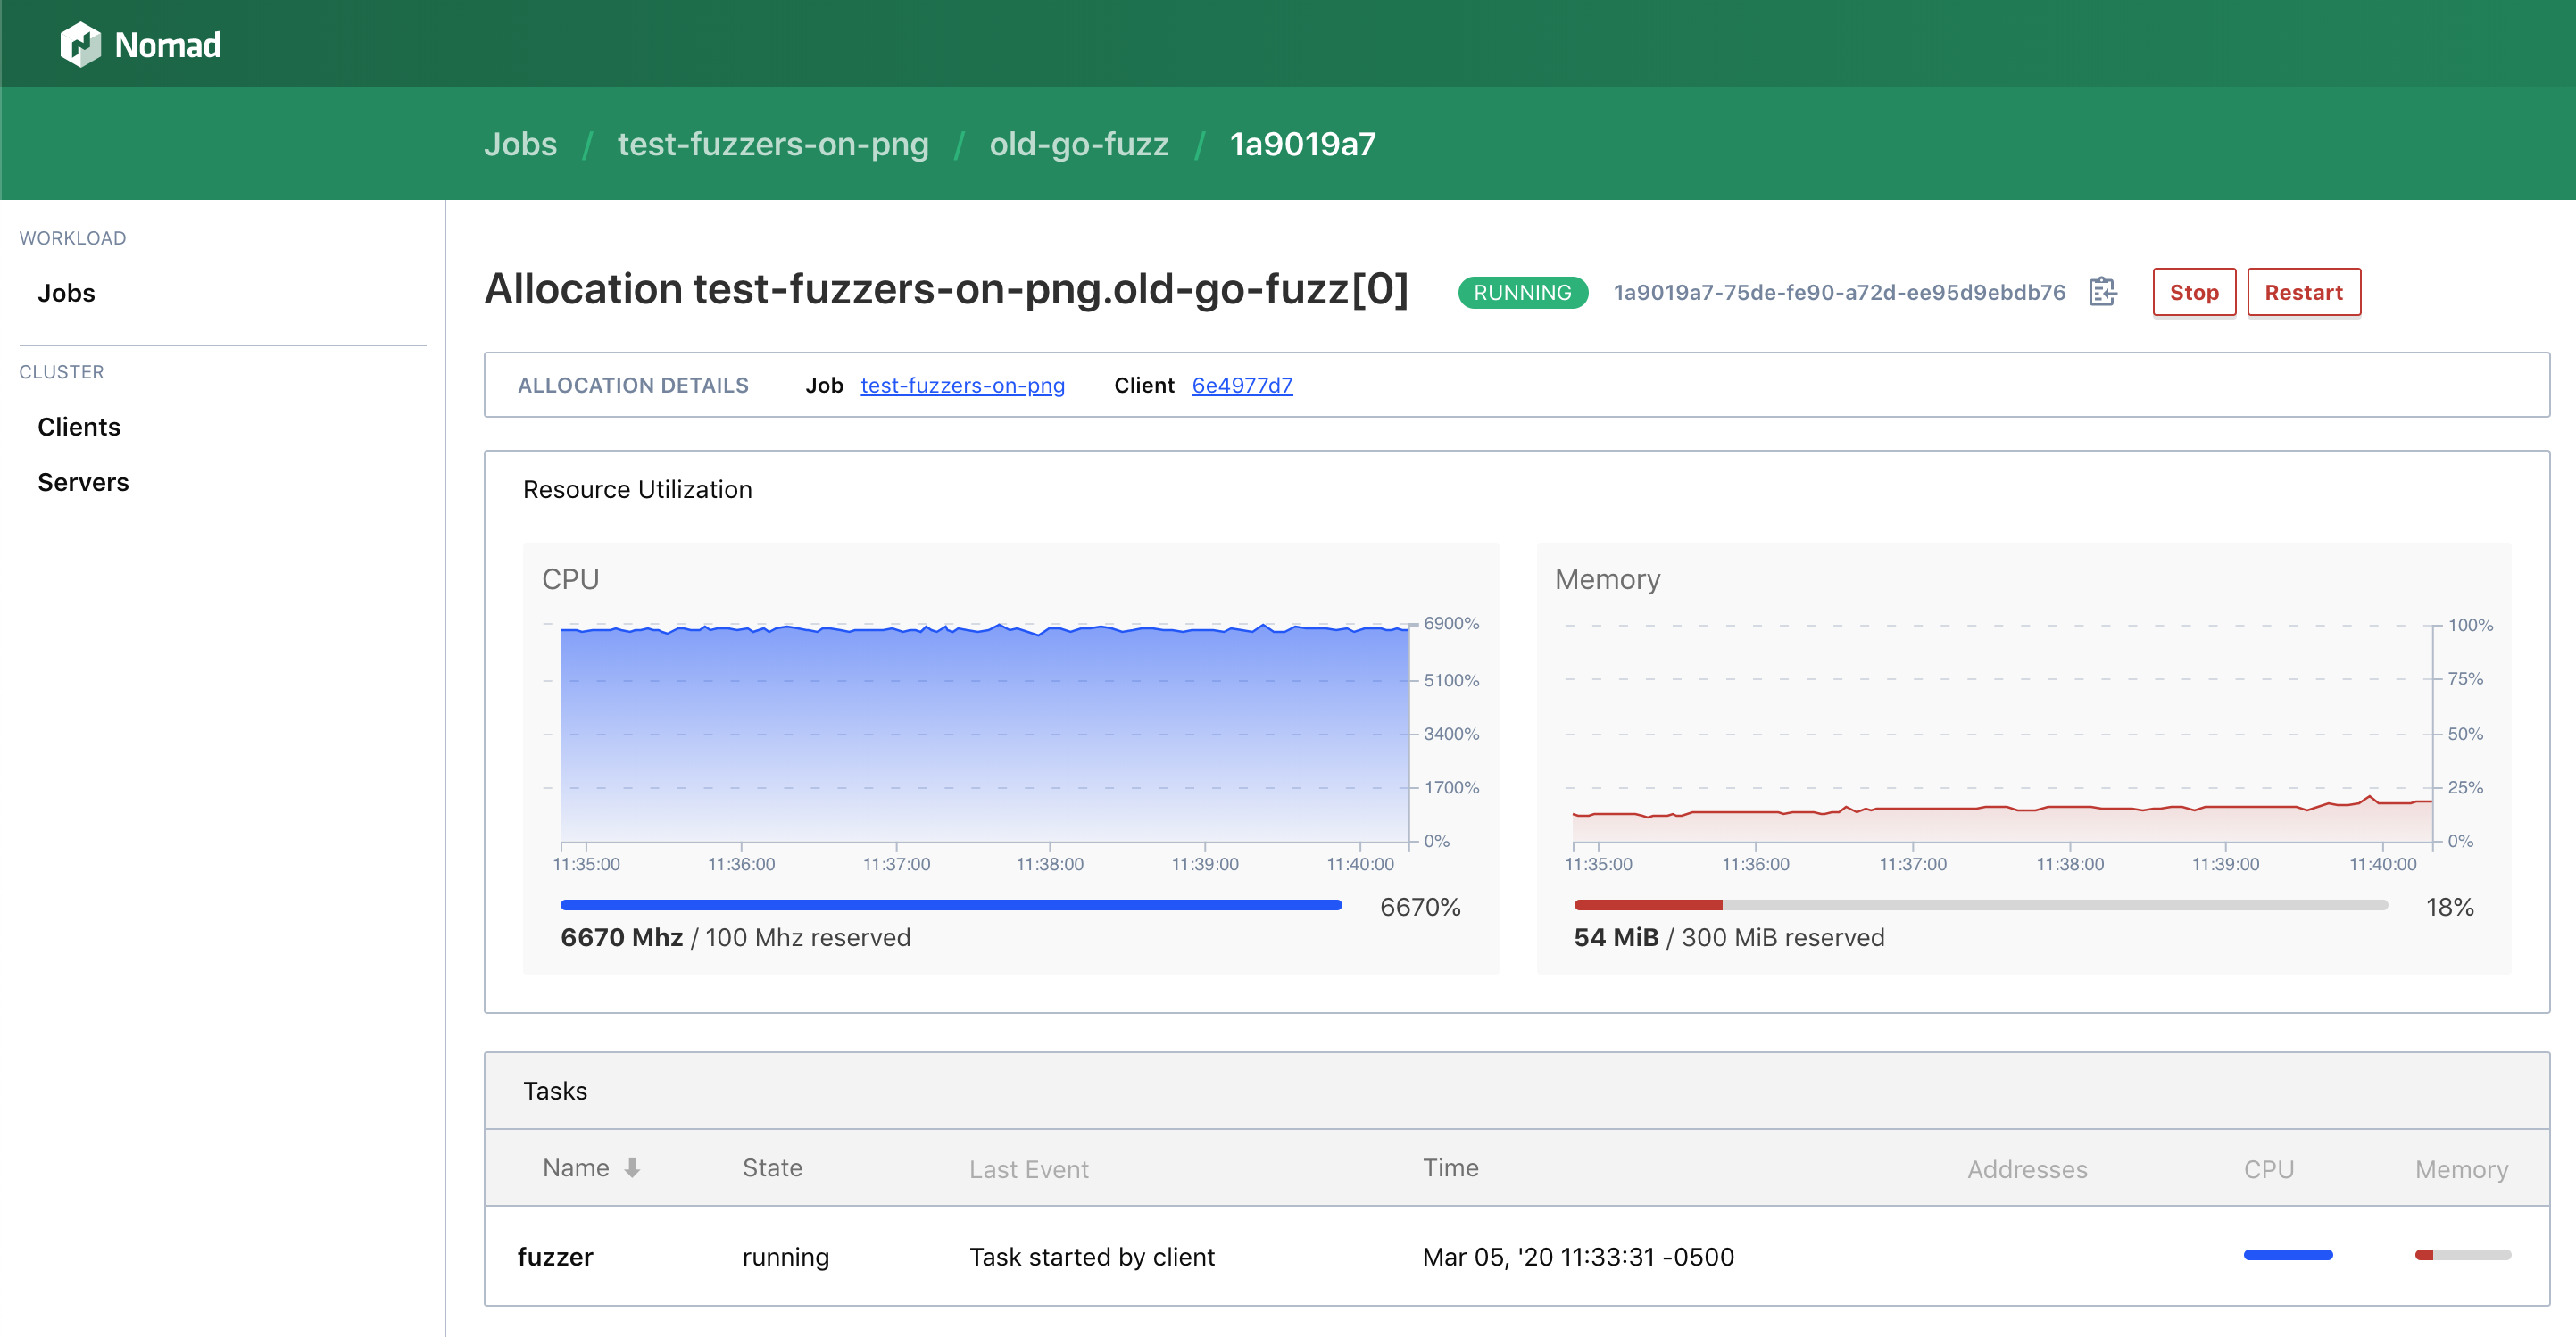
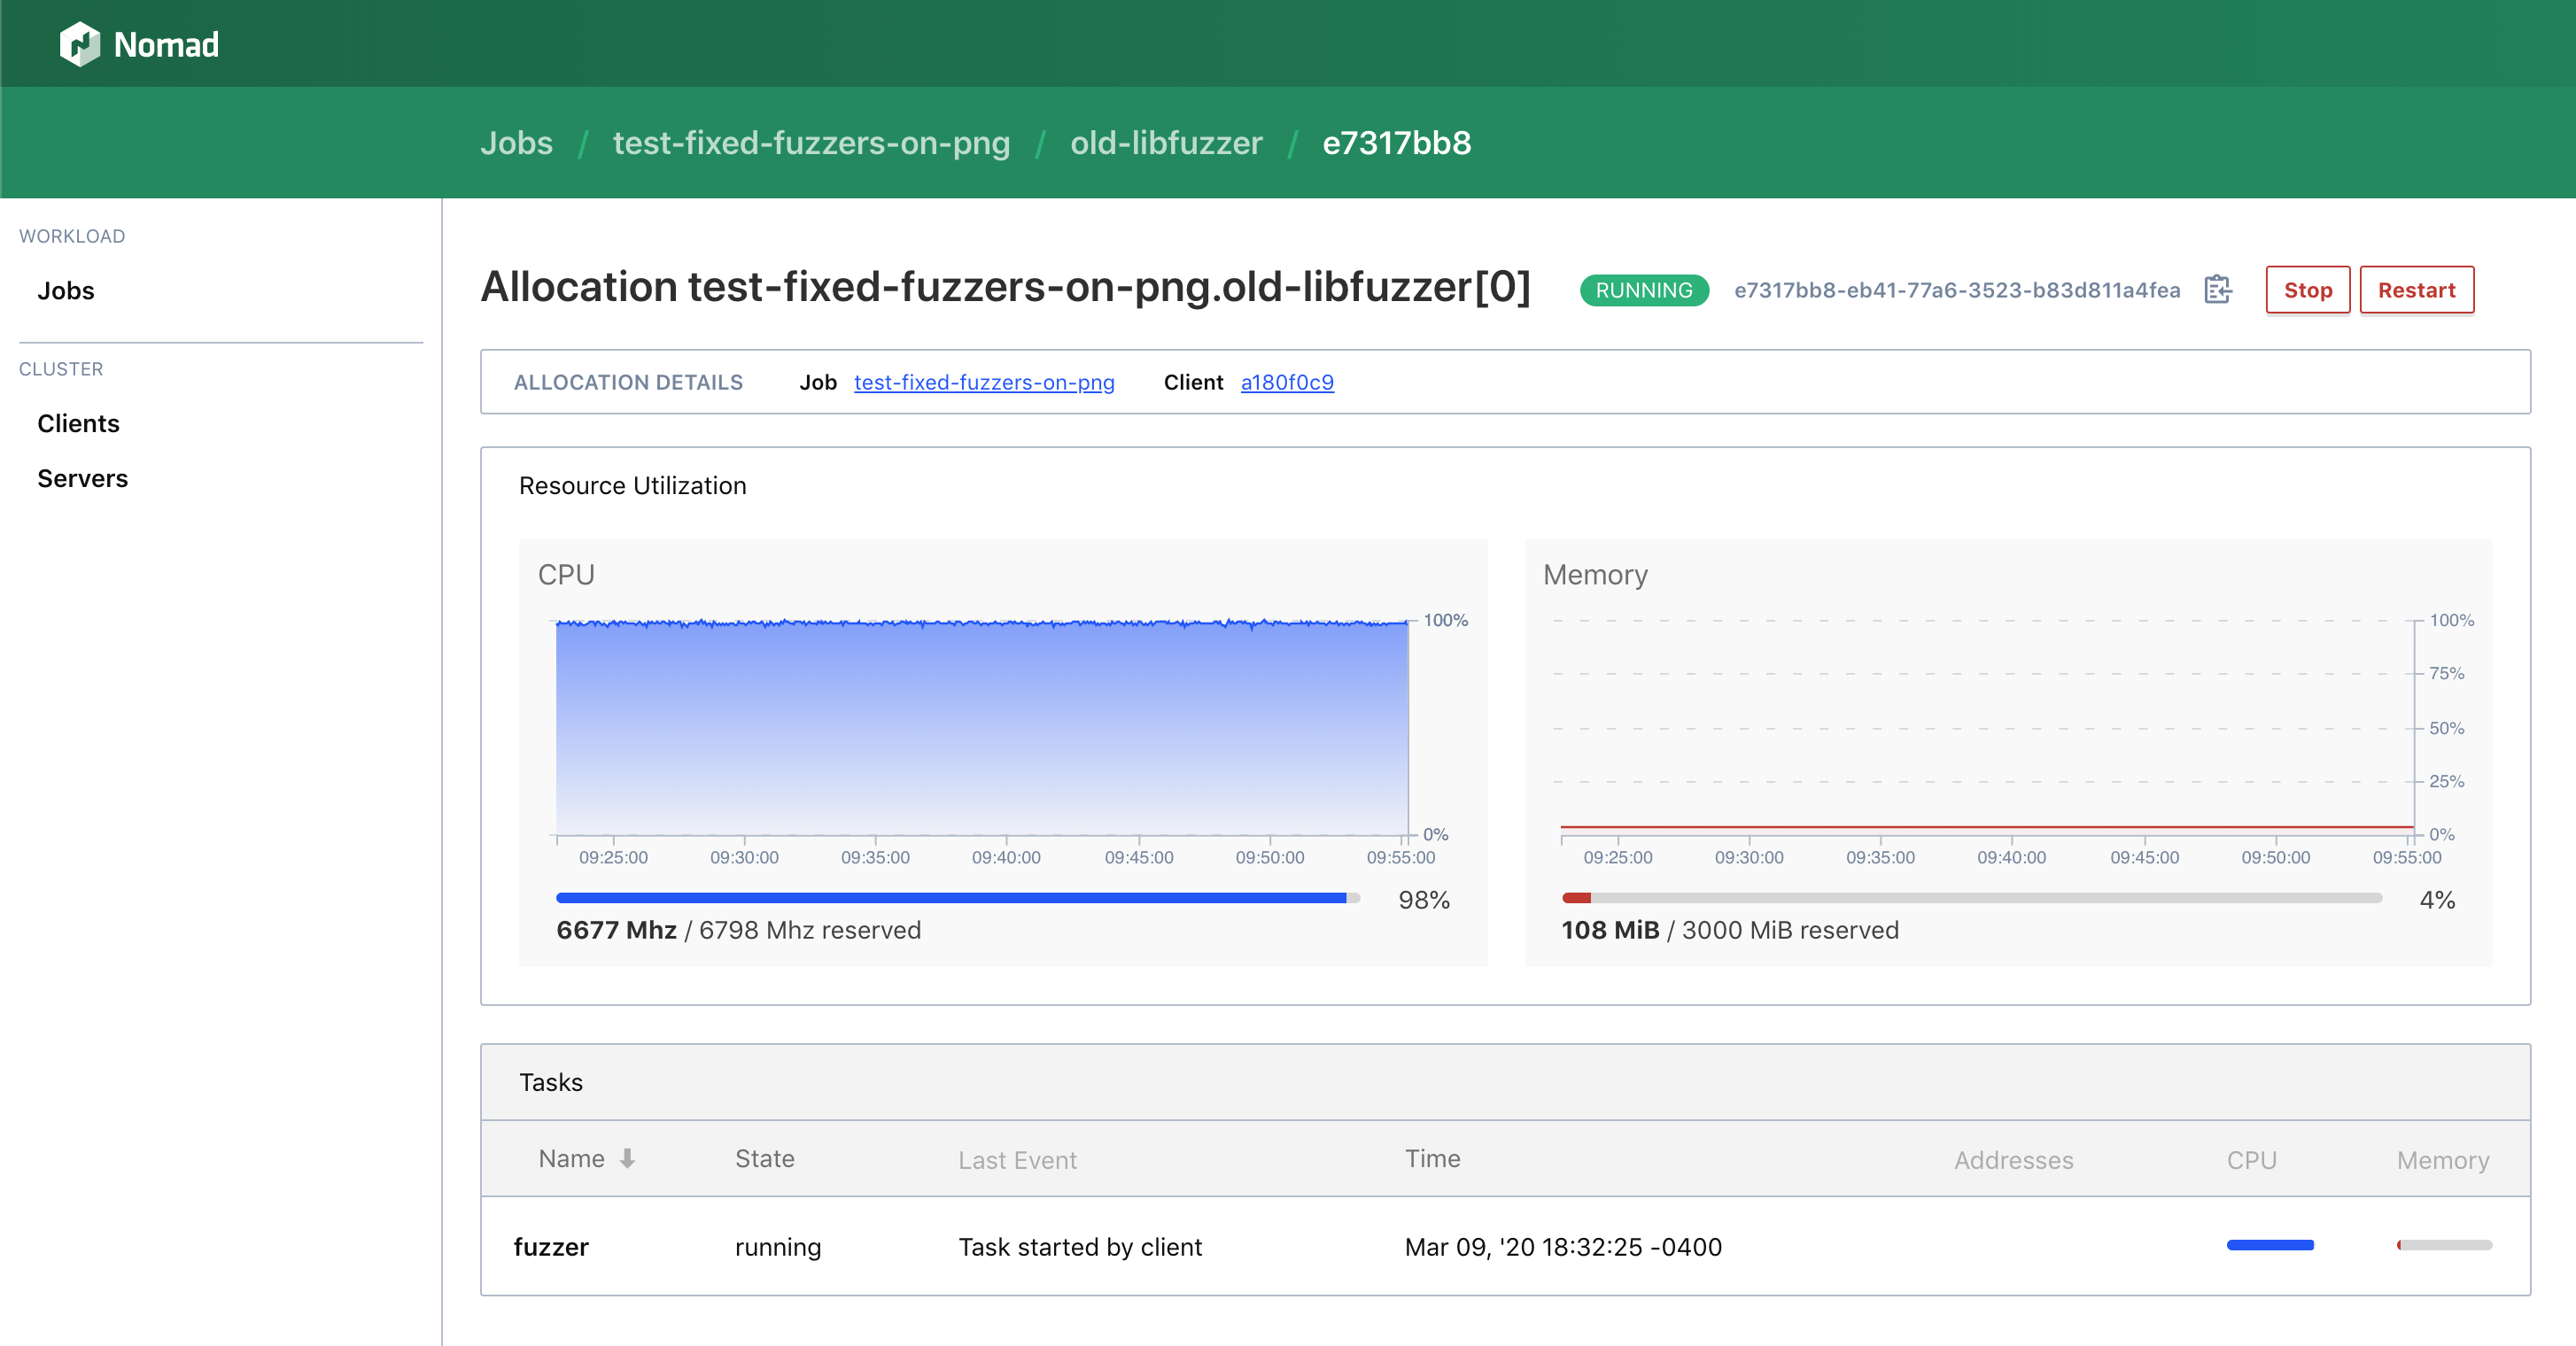
👋 Hello @mdempsky! I wanted to share some of my initial results comparing the different fuzzing options on version
Both the libfuzzer options used similar amounts of resources over extended periods of time, while using half as much CPU as the pure go-fuzz version. The newer libfuzzer option almost produced significantly more log output and had a higher exec/s. Interestingly, the native go-fuzz case seemed to have a memory leak that was immediately apparent. old-go-fuzz~7000 exec/s ... slowed down to ~700 execs/s old-libfuzzer~15500 execs/s new-libfuzzer~18500 execs/s DockerfilesTo help reproduce some of my findings, these are the containers I deployed to Nomad: png-cases.zip |


|
@picatz Thanks! I really appreciate your independent testing. It sounds like about 20% faster execution with native libfuzzer than previous libfuzzer support (which was already 2x faster than go-fuzz's own mutation engine)? By increased log output, I assume you mean reports about finding new, interesting inputs? Any concrete numbers to report there? E.g., how many interesting inputs discovered after T time duration. (new-libfuzzer supports comparison tracing, whereas old-libfuzzer does not. I'd expect this would allow new-libfuzzer to discover interesting test cases with fewer executions.) |
|
Here are the actual logs from that png case for more accurate numbers/analysis: logs.zip $ cat new-libfuzzer-logs.txt | head -n 30
INFO: Seed: 1855829159
INFO: 6009 Extra Counters
INFO: -max_len is not provided; libFuzzer will not generate inputs larger than 4096 bytes
INFO: A corpus is not provided, starting from an empty corpus
#2 INITED ft: 22 corp: 1/1b lim: 4 exec/s: 0 rss: 26Mb
#3507 NEW ft: 23 corp: 2/3b lim: 6 exec/s: 0 rss: 30Mb L: 2/2 MS: 5 CopyPart-ChangeBit-ShuffleBytes-ChangeByte-CopyPart-
#5519 NEW ft: 29 corp: 3/11b lim: 8 exec/s: 0 rss: 30Mb L: 8/8 MS: 2 ChangeByte-InsertRepeatedBytes-
#7628 NEW ft: 39 corp: 4/19b lim: 8 exec/s: 0 rss: 30Mb L: 8/8 MS: 4 ShuffleBytes-ShuffleBytes-CMP-CMP- DE: "\xff\xff\xff\xff"-"\x89PNG\x0d\x0a\x1a\x0a"-
#10742 NEW ft: 44 corp: 5/30b lim: 11 exec/s: 0 rss: 30Mb L: 11/11 MS: 4 InsertByte-InsertByte-InsertByte-PersAutoDict- DE: "\x89PNG\x0d\x0a\x1a\x0a"-
#11803 REDUCE ft: 44 corp: 5/28b lim: 11 exec/s: 0 rss: 30Mb L: 9/9 MS: 1 EraseBytes-
#17866 NEW ft: 69 corp: 6/45b lim: 17 exec/s: 0 rss: 30Mb L: 17/17 MS: 3 CrossOver-CMP-CrossOver- DE: "\x01\x00\x00\x00"-
#18345 NEW ft: 143 corp: 7/62b lim: 17 exec/s: 0 rss: 30Mb L: 17/17 MS: 4 InsertByte-CrossOver-CMP-PersAutoDict- DE: "\xff\xff\xff\xff\xff\xff\xff\xff"-"\x89PNG\x0d\x0a\x1a\x0a"-
#18358 NEW ft: 145 corp: 8/79b lim: 17 exec/s: 0 rss: 30Mb L: 17/17 MS: 3 ChangeBit-EraseBytes-InsertRepeatedBytes-
#18434 NEW ft: 148 corp: 9/96b lim: 17 exec/s: 0 rss: 30Mb L: 17/17 MS: 1 ShuffleBytes-
#18536 REDUCE ft: 148 corp: 9/95b lim: 17 exec/s: 0 rss: 30Mb L: 16/17 MS: 2 ShuffleBytes-CrossOver-
#18577 REDUCE ft: 149 corp: 10/111b lim: 17 exec/s: 0 rss: 30Mb L: 16/17 MS: 1 ChangeByte-
#20063 REDUCE ft: 149 corp: 10/110b lim: 17 exec/s: 20063 rss: 30Mb L: 16/17 MS: 1 EraseBytes-
#20959 NEW ft: 155 corp: 11/127b lim: 17 exec/s: 20959 rss: 30Mb L: 17/17 MS: 1 ChangeBit-
#21470 NEW ft: 156 corp: 12/135b lim: 17 exec/s: 21470 rss: 30Mb L: 8/17 MS: 1 ChangeBit-
#21566 REDUCE ft: 167 corp: 13/151b lim: 17 exec/s: 21566 rss: 30Mb L: 16/17 MS: 1 ChangeByte-
#27063 NEW ft: 171 corp: 14/171b lim: 21 exec/s: 27063 rss: 30Mb L: 20/20 MS: 2 EraseBytes-InsertRepeatedBytes-
#30824 NEW ft: 186 corp: 15/191b lim: 21 exec/s: 30824 rss: 30Mb L: 20/20 MS: 1 ChangeBit-
#31135 NEW ft: 187 corp: 16/212b lim: 21 exec/s: 31135 rss: 30Mb L: 21/21 MS: 1 InsertByte-
#35481 NEW ft: 188 corp: 17/236b lim: 25 exec/s: 35481 rss: 30Mb L: 24/24 MS: 1 InsertRepeatedBytes-
#55228 REDUCE ft: 197 corp: 18/264b lim: 43 exec/s: 27614 rss: 30Mb L: 28/28 MS: 2 PersAutoDict-CMP- DE: "\xff\xff\xff\xff"-"\xff\xff\xff\xff\xff\xff\xff\xff"-
#57324 NEW ft: 198 corp: 19/292b lim: 43 exec/s: 28662 rss: 30Mb L: 28/28 MS: 1 CMP- DE: "\x1a&\x0a\x1a"-
#62992 NEW ft: 200 corp: 20/331b lim: 48 exec/s: 20997 rss: 30Mb L: 39/39 MS: 3 PersAutoDict-CopyPart-CMP- DE: "\x1a&\x0a\x1a"-"\x13\x00\x00\x00\x00\x00\x00\x00"-
#63208 REDUCE ft: 200 corp: 20/330b lim: 48 exec/s: 21069 rss: 30Mb L: 38/38 MS: 1 EraseBytes-
#64160 REDUCE ft: 200 corp: 20/329b lim: 48 exec/s: 21386 rss: 30Mb L: 37/37 MS: 2 InsertRepeatedBytes-EraseBytes-
#64786 NEW ft: 204 corp: 21/357b lim: 48 exec/s: 21595 rss: 30Mb L: 28/37 MS: 1 CMP- DE: "IHDR"-Compared to the old one: $ cat old-libfuzzer-logs.txt | head -n 30
INFO: Seed: 4240969293
INFO: 65536 Extra Counters
INFO: -max_len is not provided; libFuzzer will not generate inputs larger than 4096 bytes
INFO: A corpus is not provided, starting from an empty corpus
#2 INITED ft: 28 corp: 1/1b lim: 4 exec/s: 0 rss: 26Mb
#4017 NEW ft: 35 corp: 2/9b lim: 8 exec/s: 0 rss: 30Mb L: 8/8 MS: 5 ShuffleBytes-InsertByte-CopyPart-ChangeBinInt-InsertRepeatedBytes-
#32768 pulse ft: 35 corp: 2/9b lim: 33 exec/s: 16384 rss: 31Mb
#65536 pulse ft: 35 corp: 2/9b lim: 68 exec/s: 16384 rss: 31Mb
#131072 pulse ft: 35 corp: 2/9b lim: 128 exec/s: 16384 rss: 31Mb
#262144 pulse ft: 35 corp: 2/9b lim: 261 exec/s: 16384 rss: 31Mb
#524288 pulse ft: 35 corp: 2/9b lim: 526 exec/s: 15887 rss: 31Mb
#1048576 pulse ft: 35 corp: 2/9b lim: 1050 exec/s: 15650 rss: 31Mb
#2097152 pulse ft: 35 corp: 2/9b lim: 2094 exec/s: 15650 rss: 31Mb
#4194304 pulse ft: 35 corp: 2/9b lim: 4096 exec/s: 15592 rss: 31Mb
#8388608 pulse ft: 35 corp: 2/9b lim: 4096 exec/s: 15563 rss: 31Mb
#16777216 pulse ft: 35 corp: 2/9b lim: 4096 exec/s: 15563 rss: 31Mb
#33554432 pulse ft: 35 corp: 2/9b lim: 4096 exec/s: 15548 rss: 31Mb
#67108864 pulse ft: 35 corp: 2/9b lim: 4096 exec/s: 15545 rss: 31Mb
#134217728 pulse ft: 35 corp: 2/9b lim: 4096 exec/s: 15541 rss: 31Mb
#268435456 pulse ft: 35 corp: 2/9b lim: 4096 exec/s: 15542 rss: 31Mb
#536870912 pulse ft: 35 corp: 2/9b lim: 4096 exec/s: 15547 rss: 31Mb
#1073741824 pulse ft: 35 corp: 2/9b lim: 4096 exec/s: 15557 rss: 31MbI just realized the existing corpus was only picked up by the $ cat old-go-fuzz-logs.txt | head -n 30
2020/03/05 16:33:34 workers: 2, corpus: 266 (3s ago), crashers: 0, restarts: 1/0, execs: 0 (0/sec), cover: 0, uptime: 3s
2020/03/05 16:33:37 workers: 2, corpus: 266 (6s ago), crashers: 0, restarts: 1/0, execs: 0 (0/sec), cover: 1252, uptime: 6s
2020/03/05 16:33:40 workers: 2, corpus: 266 (9s ago), crashers: 0, restarts: 1/3687, execs: 7375 (816/sec), cover: 1252, uptime: 9s
2020/03/05 16:33:43 workers: 2, corpus: 266 (12s ago), crashers: 0, restarts: 1/6042, execs: 18128 (1507/sec), cover: 1252, uptime: 12s
2020/03/05 16:33:46 workers: 2, corpus: 266 (15s ago), crashers: 0, restarts: 1/7526, execs: 22580 (1502/sec), cover: 1252, uptime: 15s
2020/03/05 16:33:49 workers: 2, corpus: 266 (18s ago), crashers: 0, restarts: 1/7556, execs: 37781 (2095/sec), cover: 1252, uptime: 18s
2020/03/05 16:33:52 workers: 2, corpus: 266 (21s ago), crashers: 0, restarts: 1/9506, execs: 66544 (3164/sec), cover: 1252, uptime: 21s
2020/03/05 16:33:55 workers: 2, corpus: 266 (24s ago), crashers: 0, restarts: 1/9496, execs: 94966 (3952/sec), cover: 1252, uptime: 24s
2020/03/05 16:33:58 workers: 2, corpus: 266 (27s ago), crashers: 0, restarts: 1/9459, execs: 122978 (4549/sec), cover: 1252, uptime: 27s
2020/03/05 16:34:01 workers: 2, corpus: 266 (30s ago), crashers: 0, restarts: 1/8870, execs: 150799 (5021/sec), cover: 1252, uptime: 30s
2020/03/05 16:34:04 workers: 2, corpus: 266 (33s ago), crashers: 0, restarts: 1/9399, execs: 178595 (5407/sec), cover: 1252, uptime: 33s
2020/03/05 16:34:07 workers: 2, corpus: 266 (36s ago), crashers: 0, restarts: 1/9385, execs: 206481 (5730/sec), cover: 1252, uptime: 36s
2020/03/05 16:34:10 workers: 2, corpus: 266 (39s ago), crashers: 0, restarts: 1/9376, execs: 234410 (6005/sec), cover: 1252, uptime: 39s
2020/03/05 16:34:13 workers: 2, corpus: 266 (42s ago), crashers: 0, restarts: 1/9717, execs: 262372 (6242/sec), cover: 1252, uptime: 42s
2020/03/05 16:34:16 workers: 2, corpus: 266 (45s ago), crashers: 0, restarts: 1/9672, execs: 290182 (6444/sec), cover: 1252, uptime: 45s
2020/03/05 16:34:19 workers: 2, corpus: 266 (48s ago), crashers: 0, restarts: 1/9635, execs: 317961 (6620/sec), cover: 1252, uptime: 48s
2020/03/05 16:34:22 workers: 2, corpus: 266 (51s ago), crashers: 0, restarts: 1/9871, execs: 345499 (6770/sec), cover: 1252, uptime: 51s
2020/03/05 16:34:25 workers: 2, corpus: 266 (54s ago), crashers: 0, restarts: 1/9812, execs: 372876 (6901/sec), cover: 1252, uptime: 54s
2020/03/05 16:34:28 workers: 2, corpus: 266 (57s ago), crashers: 0, restarts: 1/9753, execs: 399892 (7012/sec), cover: 1252, uptime: 57s
2020/03/05 16:34:31 workers: 2, corpus: 266 (1m0s ago), crashers: 0, restarts: 1/9925, execs: 426793 (7109/sec), cover: 1252, uptime: 1m0s
2020/03/05 16:34:34 workers: 2, corpus: 266 (1m3s ago), crashers: 0, restarts: 1/9992, execs: 449681 (7134/sec), cover: 1252, uptime: 1m3s
2020/03/05 16:34:37 workers: 2, corpus: 266 (1m6s ago), crashers: 0, restarts: 1/9626, execs: 471711 (7144/sec), cover: 1523, uptime: 1m6s
2020/03/05 16:34:40 workers: 2, corpus: 266 (1m9s ago), crashers: 0, restarts: 1/9849, execs: 482609 (6991/sec), cover: 1523, uptime: 1m9s
2020/03/05 16:34:43 workers: 2, corpus: 266 (1m12s ago), crashers: 0, restarts: 1/9665, execs: 512249 (7111/sec), cover: 1523, uptime: 1m12s
2020/03/05 16:34:46 workers: 2, corpus: 266 (1m15s ago), crashers: 0, restarts: 1/9845, execs: 541514 (7217/sec), cover: 1523, uptime: 1m15s
2020/03/05 16:34:49 workers: 2, corpus: 266 (1m18s ago), crashers: 0, restarts: 1/9823, execs: 569790 (7302/sec), cover: 1523, uptime: 1m18s
2020/03/05 16:34:52 workers: 2, corpus: 266 (1m21s ago), crashers: 0, restarts: 1/9921, execs: 595270 (7346/sec), cover: 1523, uptime: 1m21s
2020/03/05 16:34:55 workers: 2, corpus: 266 (1m24s ago), crashers: 0, restarts: 1/9825, execs: 618999 (7366/sec), cover: 1523, uptime: 1m24s
2020/03/05 16:34:58 workers: 2, corpus: 266 (1m27s ago), crashers: 0, restarts: 1/9733, execs: 642418 (7381/sec), cover: 1523, uptime: 1m27s
2020/03/05 16:35:01 workers: 2, corpus: 266 (1m30s ago), crashers: 0, restarts: 1/9787, execs: 665572 (7393/sec), cover: 1523, uptime: 1m30sAnd I figured out why the libfuzzer cases were using half as much CPU by default.
|
|
Modifications to my setup for the same png case:
By doing that I expected all the fuzzers would be using roughly the same amount of CPU/RAM. That does seem to be the case for the most part. More interestingly, the number of 📦 All of the Dockerfiles and logs are available here.zip Exec/s Summary
Commands I used to determine the ~Exec/s to help double check my findings.
Max$ cat new-libfuzzer.txt | grep "exec/s" | awk '{print $10}' | sort -n | tail -n 1
537
$ cat old-libfuzzer.txt | grep "exec/s" | awk '{print $10}' | sort -n | tail -n 1
1619
$ cat old-go-fuzz.txt | grep "execs:" | awk '{print $15}' | grep -oh '[0-9]\+' | sort -n | tail -n 1
6061Min$ cat new-libfuzzer.txt | grep "exec/s" | awk '{print $10}' | sort -n | head -n 1
4
$ cat old-libfuzzer.txt | grep "exec/s" | awk '{print $10}' | sort -n | head -n 1
24
$ old-go-fuzz.txt | grep "execs:" | awk '{print $15}' | grep -oh '[0-9]\+' | sort -n | head -n 1
0Average$ cat new-libfuzzer.txt | grep "exec/s" | awk '{print $10}' | ruby -e "numbers=[]; STDIN.each_line { |l| numbers << l.strip.to_i }; puts numbers.sum.fdiv(numbers.count).round(0)"
344
$ cat old-libfuzzer.txt | grep "exec/s" | awk '{print $10}' | ruby -e "numbers=[]; STDIN.each_line { |l| numbers << l.strip.to_i }; puts numbers.sum.fdiv(numbers.count).round(0)"
1172
$ cat old-go-fuzz.txt | grep "execs:" | awk '{print $15}' | grep -oh '[0-9]\+' | ruby -e "numbers=[]; STDIN.each_line { |l| numbers << l.strip.to_i }; puts numbers.sum.fdiv(numbers.count).round(0)"
1221
old-go-fuzz
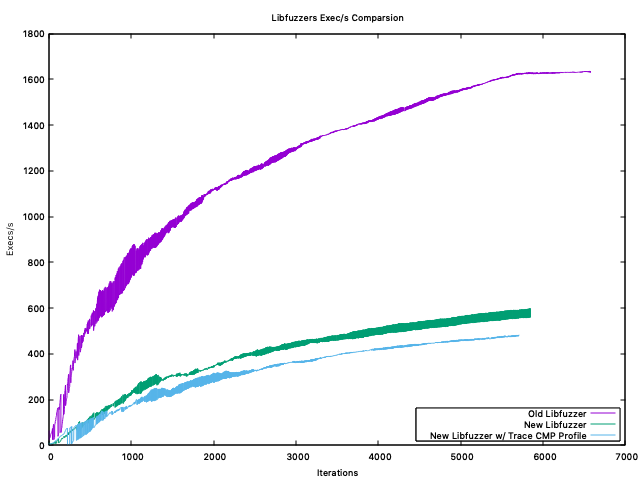
When we visualize the log output, we can actually see the number of cat old-go-fuzz.txt | grep "execs:" | awk '{print $15}' | grep -oh '[0-9]\+' | gnuplot -p -e 'plot "/dev/stdin" using 0:1 with lines'
old-libfuzzer
When we visualize the log output, we can see the number of cat old-libfuzzer.txt | grep "exec/s" | awk '{print $10}' | gnuplot -p -e 'plot "/dev/stdin" using 0:1 with lines'
new-libfuzzer
Similar to the old-libfuzzer setup, we also see the number of cat new-libfuzzer.txt | grep "exec/s" | awk '{print $10}' | gnuplot -p -e 'plot "/dev/stdin" using 0:1 with lines'
Obviously, more testing is required! |


|
@picatz Thanks. Any insight into why adding more CPU caused the libfuzzer performance to drop so significantly? It would also be interesting if you could plot the corpus size over time for each fuzzer. |
|
@mdempsky My hunch right now (based on the following corpus plots) is that it probably has to do with doing more "work" per execution. 🤔 The libfuzzer variants from before I added the corpus directories were really just be "spamming" bytes, since they had no corpus to work from. Because of this, it also created a much smaller pool of bytes/corpus over time as it discovered interesting inputs. These smaller inputs would be subsequently much faster to handle/parse, minimize, mutate, etc. To further show that might be the case, here are the numbers for the corpuses at the "end" of two runs, one with a corpus, one without:
Both of the libfuzzer variants also seem to be doing some sort of minimization. When I pass in a corpus with 266 inputs, the corpus log output will start at 210 for both of them. $ cat old-libfuzzer.txt | grep "corp:" | awk '{print $6}' | awk -F "/" '{print $1}' | head -n 1
210
$ cat new-libfuzzer.txt | grep "corp:" | awk '{print $6}' | awk -F "/" '{print $1}' | head -n 1
210More Cluster Setup / Client CPU Info
The cluster is running three clients in a cloud provider with identical disk, (2) CPU and (4gb) RAM configuration. Each fuzzer is running on a uniq client. $ lscpu
Architecture: x86_64
CPU op-mode(s): 32-bit, 64-bit
Byte Order: Little Endian
CPU(s): 2
On-line CPU(s) list: 0,1
Thread(s) per core: 2
Core(s) per socket: 1
Socket(s): 1
NUMA node(s): 1
Vendor ID: GenuineIntel
CPU family: 6
Model: 85
Model name: Intel(R) Xeon(R) Platinum 8124M CPU @ 3.00GHz
Stepping: 4
CPU MHz: 3399.963
BogoMIPS: 5999.99
Hypervisor vendor: KVM
Virtualization type: full
L1d cache: 32K
L1i cache: 32K
L2 cache: 1024K
L3 cache: 25344K
NUMA node0 CPU(s): 0,1
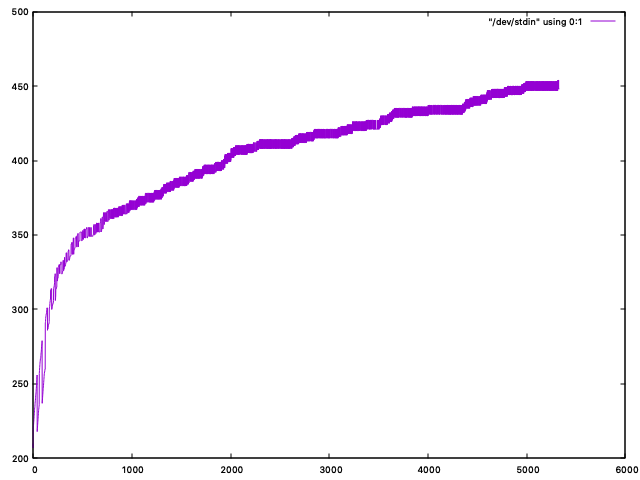
Flags: fpu vme de pse tsc msr pae mce cx8 apic sep mtrr pge mca cmov pat pse36 clflush mmx fxsr sse sse2 ss ht syscall nx pdpe1gb rdtscp lm constant_tsc rep_good nopl xtopology nonstop_tsc cpuid aperfmperf tsc_known_freq pni pclmulqdq ssse3 fma cx16 pcid sse4_1 sse4_2 x2apic movbe popcnt tsc_deadline_timer aes xsave avx f16c rdrand hypervisor lahf_lm abm 3dnowprefetch invpcid_single pti fsgsbase tsc_adjust bmi1 hle avx2 smep bmi2 erms invpcid rtm mpx avx512f avx512dq rdseed adx smap clflushopt clwb avx512cd avx512bw avx512vl xsaveopt xsavec xgetbv1 xsaves ida arat pku ospkeHere are the plots for the corpus size: old-go-fuzzcat old-go-fuzz.txt | grep "corpus:" | awk '{print $6}' | gnuplot -p -e 'plot "/dev/stdin" using 0:1 with lines'
old-libfuzzercat old-libfuzzer.txt | grep "corp:" | awk '{print $6}' | awk -F "/" '{print $1}' | gnuplot -p -e 'plot "/dev/stdin" using 0:1 with lines'
new-libfuzzercat new-libfuzzer.txt | grep "corp:" | awk '{print $6}' | awk -F "/" '{print $1}' | gnuplot -p -e 'plot "/dev/stdin" using 0:1 with lines'
|


|
@mdempsky Just wondering, does the coverage instrumentation preserve directionality of edges? That is, for the example in the AFL whitepaper, are the following traces distinguished? |
|
@smasher164 It inserts a counter after every control flow branch. I believe this is equivalent to directed location pairs within a function, but it does miss out on indirect cross-function tuples (eg, calling a function via a variable or interface, or returning from a function). |
|
I don't know if Go instrumentation already does this or not, but FWIW both go-fuzz and libfuzzer split critical CFG edges (go-fuzz by a very naive approach of adding missing else's to if's and default cases to all switches). this gives quite important signal too. This is not necessary if the fuzzer converts BBs to edges itself (e.g. AFL with limited binary instrumentation), but libfuzzer does not do this and relies on compiler to do good instrumentation. |
|
@dvyukov cmd/compile's libfuzzer mode does roughly the same approach as go-fuzz: it adds missing elses and default cases. |
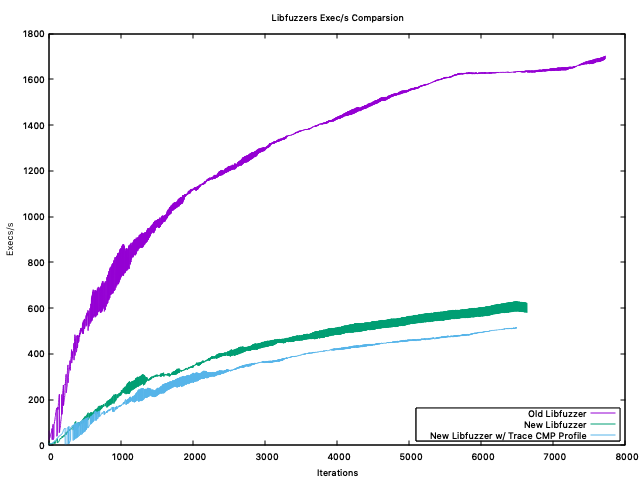
Comparing LibFuzzersWith the previous
I've had these three containers ( not including
Execs/sThe
After the weekend (~2 more days)
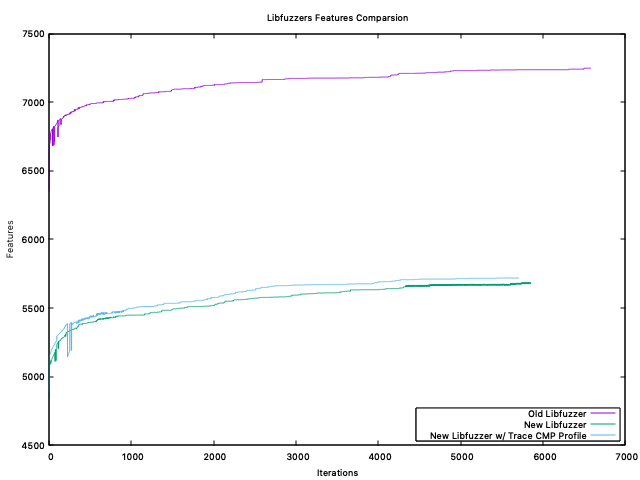
Features
Interestingly,
After the weekend (~2 more days)
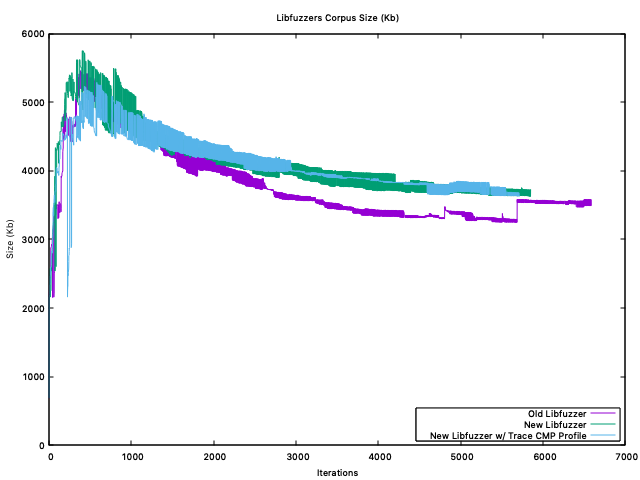
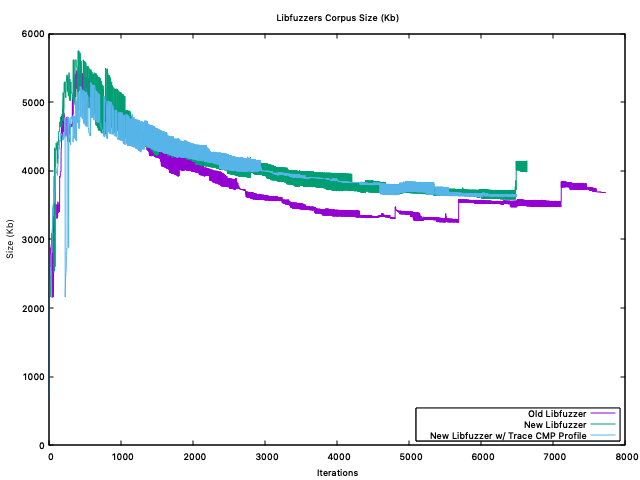
Corpus Size ( Kb )The
After the weekend (~2 more days).
Corpus FilesThe
After the weekend (~2 more days)
Next Steps
Interpreting Results@mdempsky Unless I'm misinterpreting, or messing up my graphs... |


|
What's on the X axis (iterations)? |
|
One "iteration" would be one line from a fuzzer's worker log output. Each variant has two workers/jobs, so I'm joining the log output (with |
|
I assume it prints a line every 10 secs or so. What I was getting at is that in my experience fuzzing behavior over a short period of time does not matter much. If a bug is found within seconds, minutes or hours it does not matter much. There may be some difference between day and days for some use cases. But if we are talking about finding longer tail of bugs, this involves continuous fuzzing that runs for weeks/months/years. What matters then is the rooftop after months of fuzzing on fully saturated corpus. And this usually conflicts with raw speed, "fast and dumb" is important during first hours of fuzzing, but then it becomes more important how smart the fuzzer is. And being smarter generally means being slower. |
|
I really appreciate the insight @dvyukov! To determine if a corpus has become fully saturated, would I monitor the features/coverage for a fuzzer and wait for it to plateau for prolonged period of time? |
|
There is no strict procedure and "fully saturated" is not strictly defined anyway. But I would at least run a fuzzer overnight and, yes, not getting new coverage for some time. |
|
Also: Design Draft: First Class Fuzzing https://go-review.googlesource.com/c/proposal/+/243947/4 Discussion(empty for now): https://golang.org/issue/40307 |
|
Change https://golang.org/cl/351314 mentions this issue: |
For #48504
Related #14565

Change-Id: Ibe43c75224525c4b80dbb66a1b6e0d688e47e2e4
Reviewed-on: https://go-review.googlesource.com/c/go/+/351314
Trust: Jay Conrod <jayconrod@google.com>
Trust: Katie Hockman <katie@golang.org>
Run-TryBot: Jay Conrod <jayconrod@google.com>
TryBot-Result: Go Bot <gobot@golang.org>
Reviewed-by: Katie Hockman <katie@golang.org>
|
More improvements to instrumentation are already merged into master and are to be released in Go 1.19: https://github.com/golang/go/pulls?q=is%3Apr+author%3Akyakdan+is%3Aclosed They mainly include:
|
Go-fuzz (https://github.com/dvyukov/go-fuzz) is quite successful at finding bugs in Go code and reasonably widely used in Go community. However there are several problems with the current go-fuzz implementation that hinder wider adoption (in particular internal adoption at Google):
Ideally we have coverage instrumentation in compiler, and corresponding support in go tool. Something similar to -race flag, which triggers compiler instrumentation and adds race build tag.
The text was updated successfully, but these errors were encountered: